Wireshark for beginners: packet capture basics
A packet capture is a few thousand small events in time order, and Wireshark's job is to let you look at them from the right distance: the whole conversation table, one stream, or one packet's bytes. This is the first hour: the handful of views and filters that get a beginner from an opened pcap to a readable story.
Open the capture and fix the clock
Wireshark is free; install it from wireshark.org (our tools page has a setup note). Open the .pcap or .pcapng with File, then Open. You'll see three panes: the packet list on top, the decoded fields of the selected packet in the middle, and the raw bytes at the bottom. Beginners live in the top pane. Analysts spend more time in the middle one.
Before anything else, set the time display. View, then Time Display Format, then UTC Date and Time of Day. The default shows seconds since the start of the capture, which is useless for lining packets up against a log file, and the local-time option silently uses whatever zone your laptop is in. Pick UTC and say so in your notes.
Display filter vs capture filter
Wireshark has two filter languages, and confusing them is the most common beginner error.
- A capture filter decides what gets recorded in the first place. It uses BPF syntax (
port 53,host 10.0.0.5) and is set before you start capturing. If you're opening a file someone else captured, it's irrelevant: the decision has already been made. - A display filter decides what you see out of what was recorded. It uses Wireshark's own syntax (
dns,ip.addr == 10.0.0.5,http.request) and goes in the green bar above the packet list. Nothing is deleted; clear the bar and everything is back.
In the classroom you almost always have a file, so you're always writing display filters. The ones you'll type most:
ip.addr == 10.0.0.5: anything to or from a host.dns,http,tls,smb2,ftp: one protocol.tcp.port == 4444: one port, either direction.tcp.stream eq 12: one TCP connection, start to finish.!(arp or dhcp): hide the chatter.
The bar turns red when the syntax is wrong and green when it's valid. You can also right-click any field in the middle pane and choose Apply as Filter, which writes the syntax for you and is how most people learn it.
Statistics: Conversations and Endpoints
Don't start by scrolling packets. Start with Statistics, then Conversations. The IPv4 and TCP tabs list every pair of hosts that talked, with packet counts, bytes in each direction, start time and duration. Sort by bytes to see where the volume went. Sort by duration to see what stayed connected. Sort by start time to see the order things happened. A capture with 40,000 packets usually has a dozen conversations that matter, and this table is where you find them.
$ tshark -r capture.pcap -q -z conv,tcp
================================================================================
TCP Conversations
Filter:<No Filter>
                                                           |       <-      | |       ->      | |     Total     |    Relative    |   Duration   |
                                                           | Frames  Bytes | | Frames  Bytes | | Frames  Bytes |      Start     |              |
...
10.89.97.117:50594         <-> 40.99.232.180:443               74 98 kB          44 7702 bytes     118 106 kB     1073.103746000        52.0469
10.89.97.117:61090         <-> 172.217.10.128:443              67 88 kB          40 5650 bytes     107 93 kB       126.460510000        22.6873
10.89.97.117:53751         <-> 40.99.232.180:443               65 87 kB          40 5759 bytes     105 92 kB       472.090003000        52.5031
10.89.97.117:56403         <-> 204.79.197.239:443              61 80 kB          38 6200 bytes      99 86 kB       551.753171000       112.5076
10.89.97.117:57515         <-> 140.82.113.6:443                58 75 kB          36 6671 bytes      94 82 kB      1173.182627000        70.7985
10.89.97.117:53816         <-> 204.79.197.200:443              57 76 kB          35 5867 bytes      92 82 kB       291.203996000        49.6170
...
================================================================================Endpoints is the same data by single host rather than by pair: which addresses appear at all, and how much each sent and received. It's the quickest answer to "which internal host is this capture about" and "how many outside addresses did it talk to". Protocol Hierarchy, in the same menu, tells you what kinds of traffic are present before you filter for any of them.
Right-click any row in Conversations and choose Apply as Filter to drop straight from the table to the packets behind it.
Read a capture from the outside in: who talked to whom, then which conversation, then which stream, then which packet. Starting at the packet is starting in the wrong place.
Follow the stream, export the objects, save the subset
Once you have a conversation, select one of its packets and choose Analyze, then Follow, then TCP Stream. Wireshark reassembles the whole connection and shows it as text, one color per direction. For a plaintext protocol this is the moment the traffic becomes legible: an HTTP request and its response, an FTP login and the file it fetched, an SMTP envelope. Use the direction dropdown to show one side only, and Save As to keep the stream as a file.
File, then Export Objects, then HTTP (or SMB, FTP-DATA, TFTP) lists every file that crossed the wire in that protocol and lets you save them. Hash what you save; the hash is the thing you'll report. This is how a student in First Look: Reading a Packet Capture gets from "a file transfer happened" to "this file, with this hash, went from this host to this one at this time".
Finally, when you have the conversation that matters, save it on its own. With a display filter applied, choose File, then Export Specified Packets, select All packets: Displayed, and write a new .pcapng. Hash the new file and note the filter you used to produce it. You now have a small capture you can attach to a report, hand to a classmate, or open in another tool, and a line in your notes that lets anyone reproduce it from the original.
Reading DNS and HTTP at a glance
Two protocols carry most of the story in a beginner's capture, and both read well in the packet list once you know which columns to watch.
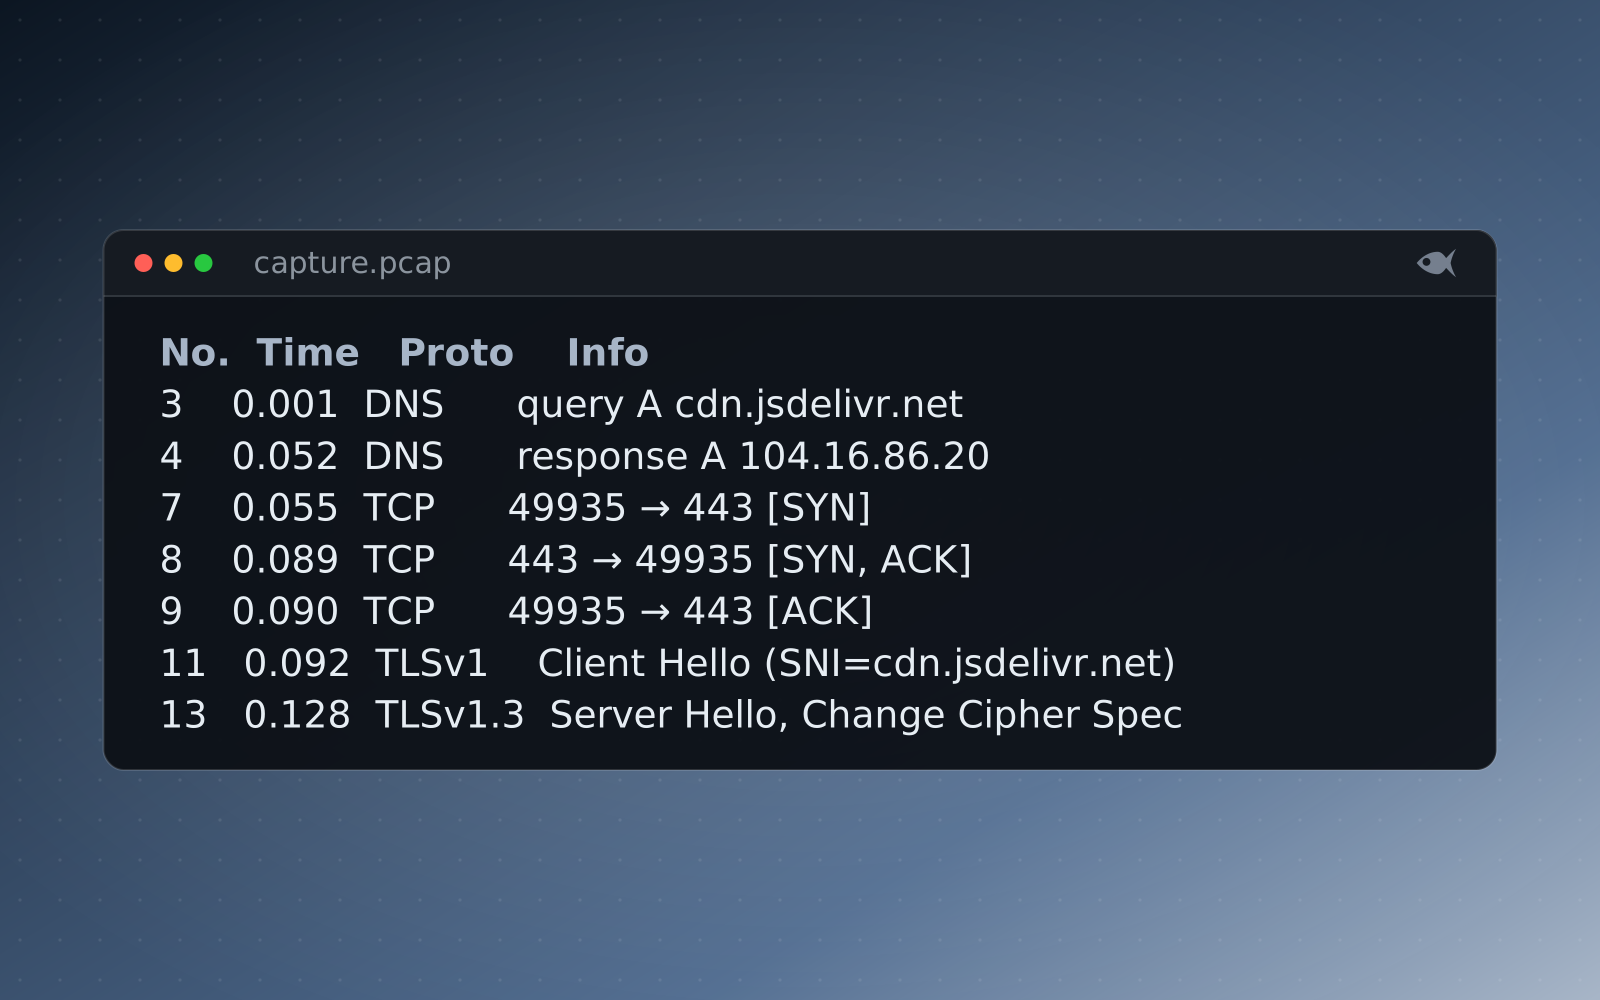
DNS. Filter dns. Each query and its response appear as a pair; the Info column shows the name asked for and, on the response line, the address returned. Filter dns.flags.response == 0 to see only the questions, which is a compact list of every name the host tried to resolve, in order. A name you don't recognize, followed a second later by a TCP connection to the address it returned, is the thread to pull. The beaconing post picks it up from there.
$ tshark -r capture.pcap -t ud -Y "dns.flags.response == 0"
    3 2025-06-03 12:14:06.246986 10.89.97.117 → 10.89.97.10  DNS 76 Standard query 0x644b A cdn.jsdelivr.net
   46 2025-06-03 12:16:12.703610 10.89.97.117 → 10.89.97.10  DNS 74 Standard query 0x5d28 A www.google.com
  155 2025-06-03 12:17:09.681013 10.89.97.117 → 10.89.97.10  DNS 89 Standard query 0x8e47 A v10.events.data.microsoft.com
  181 2025-06-03 12:17:28.608692 10.89.97.117 → 10.89.97.10  DNS 77 Standard query 0xec51 A fonts.gstatic.com
  209 2025-06-03 12:17:39.382235 10.89.97.117 → 10.89.97.10  DNS 85 Standard query 0x171c A login.microsoftonline.com
  239 2025-06-03 12:17:51.391959 10.89.97.117 → 10.89.97.10  DNS 91 Standard query 0xf162 A fe3cr.delivery.mp.microsoft.com
...-Y. -t ud prints UTC date and time, like the View setting above. Trimmed. Each row is one question: frame number, time, client, resolver, and the name asked for.HTTP. Filter http.request to see only requests: method, host and path, one per line. Add http.host and http.user_agent as columns (right-click the field, Apply as Column) and the list becomes a browsing history with the client software attached. http.response.code on the responses tells you what the server said. Most web traffic today is TLS and won't decode; filter tls.handshake.type == 1 and read the Server Name field to see which hosts were contacted even when the content is opaque.
That's the whole first hour: fix the clock, write display filters, read Conversations before packets, follow the stream, export the objects, learn the DNS and HTTP columns, save the subset. In Red Herrings, network cases ship real pcap files where every student's hosts, names and transferred file are their own, so these steps produce a different correct answer for each of them and the same method for all. The network forensics pathway on the pathways page starts with the First Look above and climbs from there.
Run the free First Look cases or download the sample lab, or start the 30-day trial with sample cases to try, and generate a per-student case.